gann analysis through excel
gann analysis and trading software
top_corner

GATE Packages

GATE Ultimate PLUS

GATE Fundamentals

GATE Functions


NEWSLETTER

Join our mailing list and stay in touch with the latest GATE news and research


GATE Brochures

Download Brochure


home products products client area contact us useful links

GATE –  Techniques using the Square of 9

his functions calculates the performance of each of the current Techniques (currently 15) for a Market. This allows a Trader to evaluate the past performance of a technique.as well as the harmony in the MArket for a current Swing top or bottom that is being formed, or has just been formed. A brief description of the techniques is:

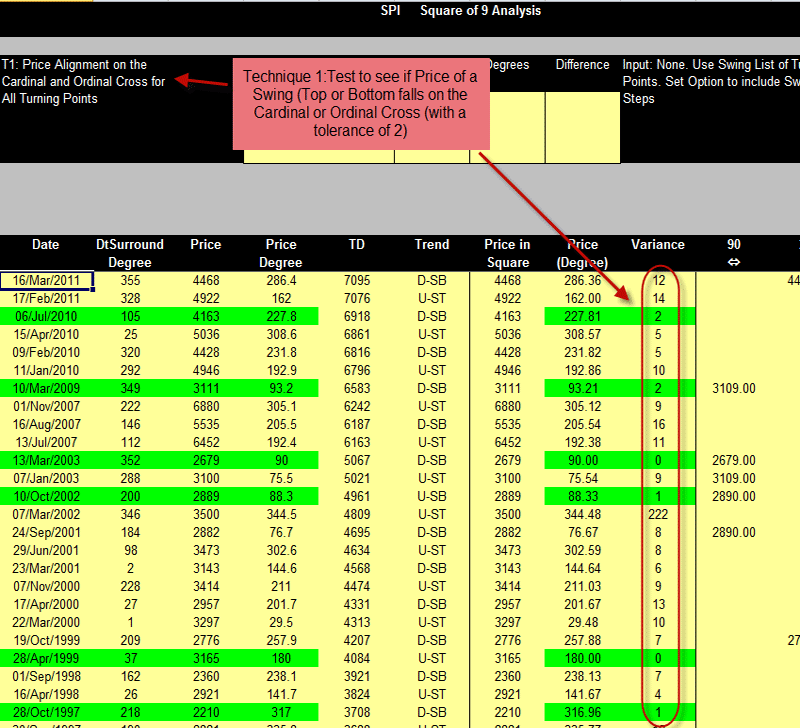
  • Technique 1: Price Alignment on the Cardinal and Ordinal Cross for All Turning Points
  • Technique 2: Date Alignment around the Date circle - Look for Alignment between any two Turning Point Dates
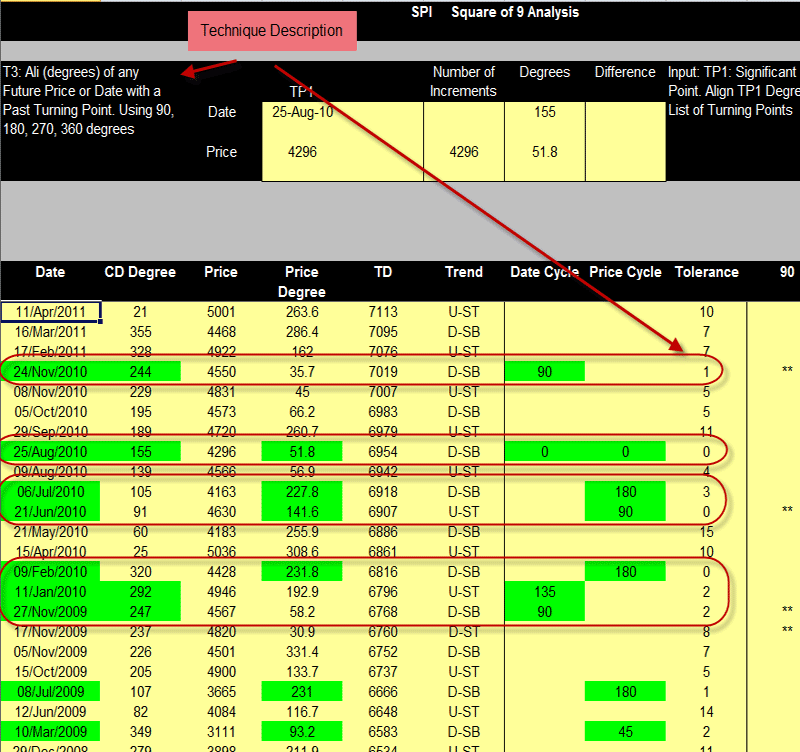
  • Technique 3: Align (degrees) of any Future Price or Date with a Past Turning Point. Using 90, 180, 270, 360 degrees
  • Technique 4: Extend Price Degrees to give Date, Extend Date Degrees to give Price
  • Technique 5: Find Time Range (degrees) between 2 Significant Turning Points. Match Time Range Degrees From a Significant Date to Future Turning Point
  • Technique 6: Use Birth Date (or a Significant date) as Center - Align All Future Turning Points where Time Range falls on the Cardinal and Ordinal Cross
  • Technique 7: Align Price Range between Top/Bottom and Subsequent Bottom/Top on the Cardinal and Ordinal Cross
  • Technique 8: Date Surround Degrees and Price Range Harmony - Harmony for a Significant Turning Point
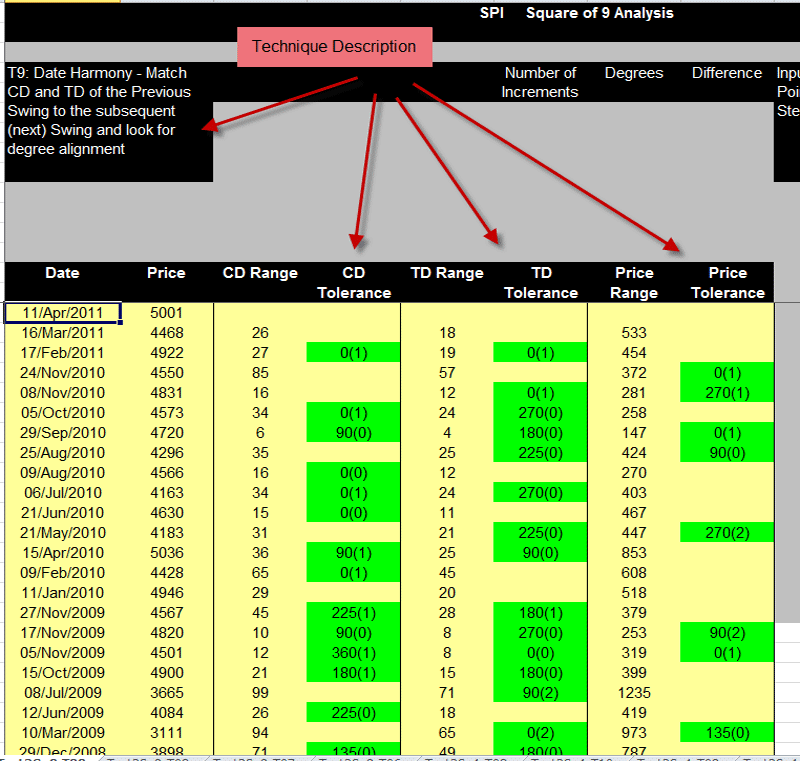
  • Technique 9: Date Harmony - Match CD and TD of the Previous Swing to the subsequent (next) Swing and look for degree alignment
  • Technique 10: Create Channel from Date and Price
  • Technique 11: Current Price Degrees alignment with compared with Current Time Range
  • Technique 12: Current Price Range alignment with Previous Time Range
  • Technique 13: Current Time Range alignment with previous Price Range
  • Technique 14: Price at Previous Swing alignment with current Time Range
  • Technique 15: Current Price Range alignment with current Time Range

Highlights

  • Flexible and minimal key in of data through the use of Quick keys
  • Instant calculations - see the results immediately
  • Highlights show previously matched results
  • Save multiple studies through the use of Prefixed names and multiple workbook names
  • Switch between Squares and Analysis at any time.

Examples

<

Square of 9 using a Swing Date or Price (Click link to view Video)


The example -SPI - using a previous Swing to construct the Square of Nine - and an analysis of the subsequent (future) Swings that fall on or near the Cardinal and Ordinal Cross

SP500 Chart

An Analysis of the FUTURE Dates (SPI) Using Technique 3

SP500 Analysis

An Analysis of the FUTURE Dates (SPI) Using Technique 9
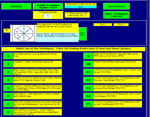
SP500 Chart


The example - Wheat - using a previous Swing to construct the Square of Nine - and an analysis of the subsequent (future) Swings that were identified from the Square
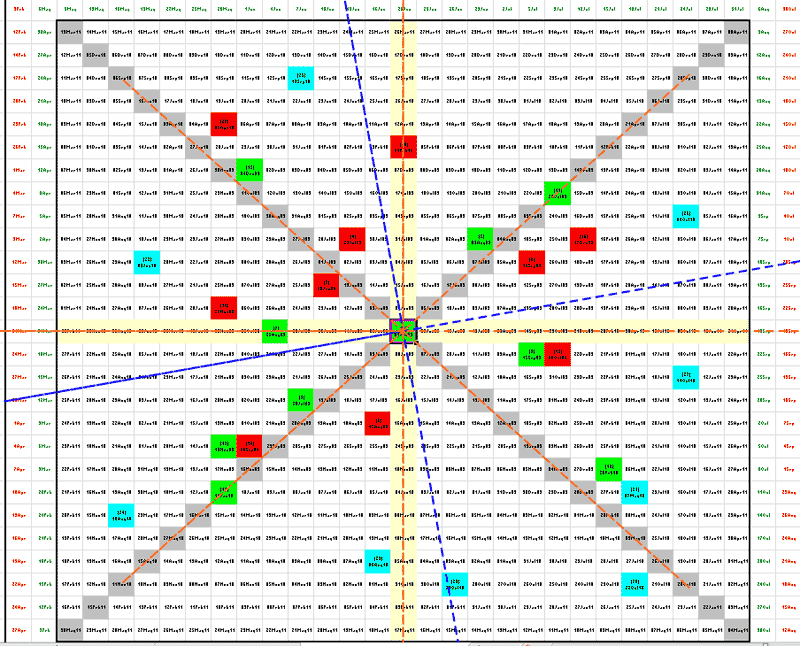
Wheat Sq 9

An Analysis of the FUTURE Dates (Wheat) that fall on or near the Cardinal and Ordinal Crosses
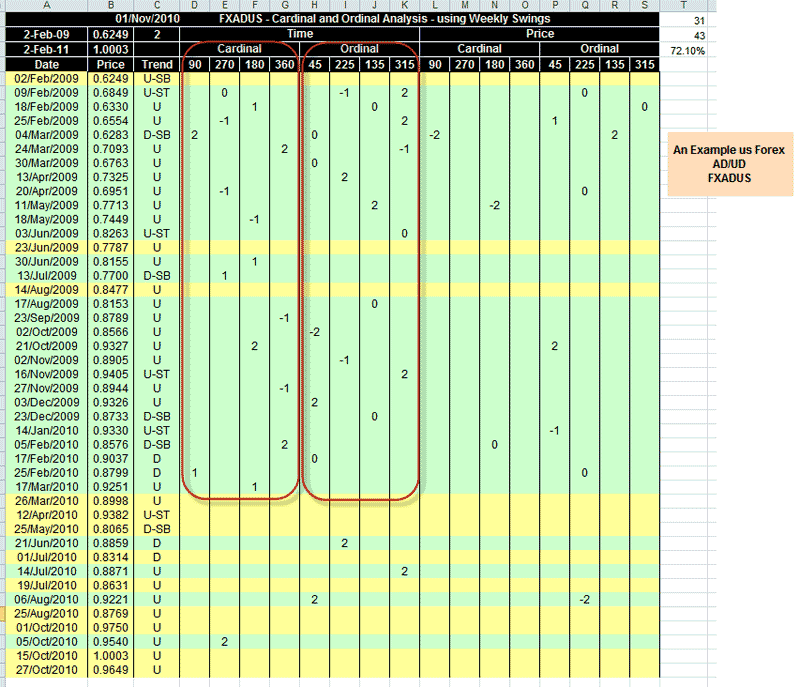
Wheat ANlaysis

Future Dates that fell on the Cardinal and Ordinal Crosses - shown on a Chart
Chart drawn using Profit Source (NOT included in GATE)
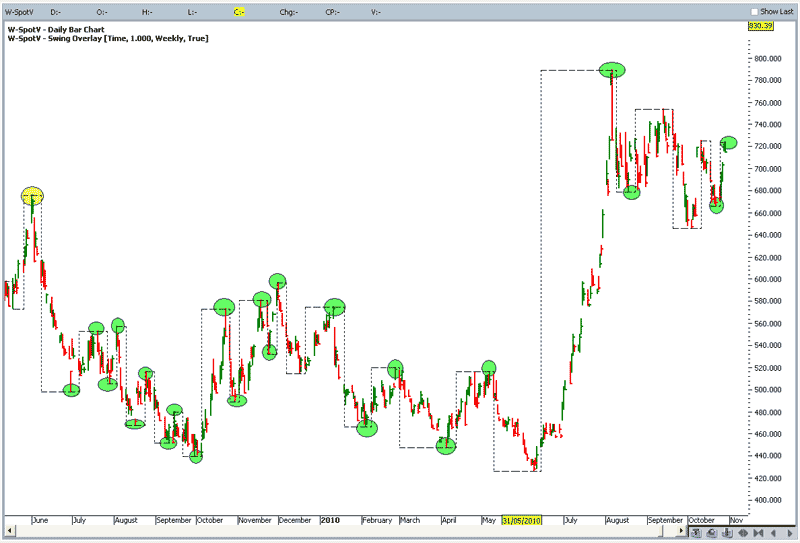
Wheat Chart


The example - FXADUS - using a previous Swing to construct the Square of Nine - and an analysis of the subsequent (future) Swings that were identified from the Square
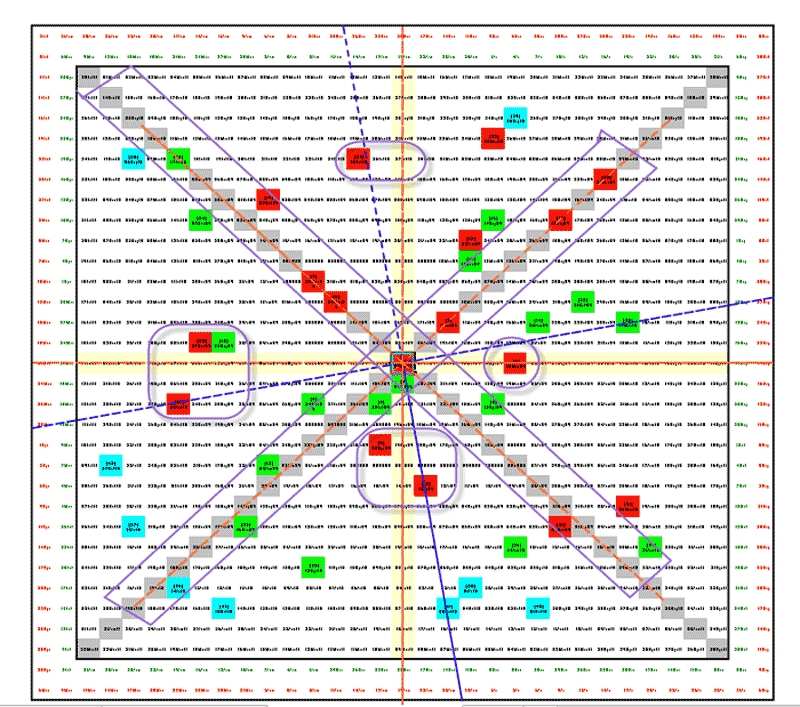
FXADUS Sq 9

An Analysis of the FUTURE Dates (FXADUS) that fall on or near the Cardinal and Ordinal Crosses
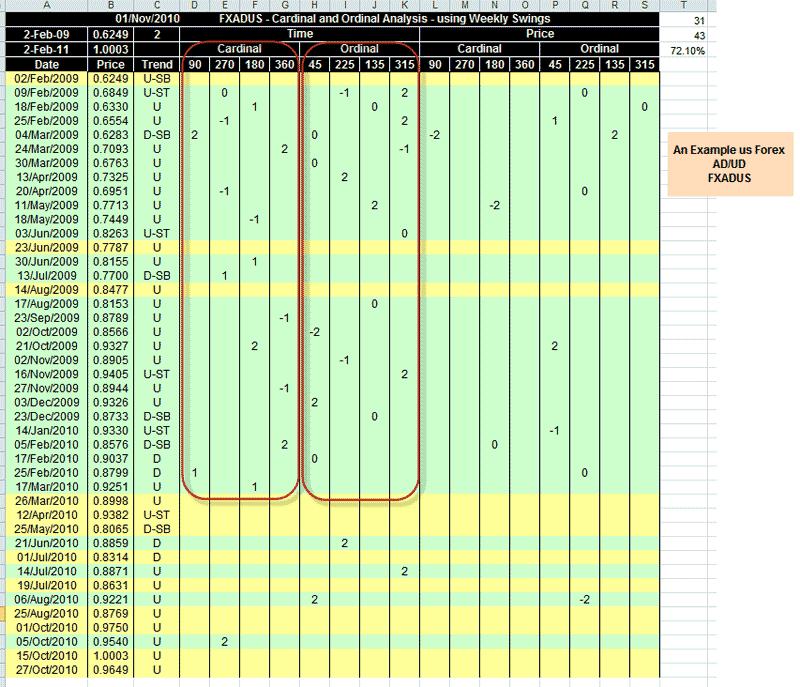
FXADUS Analysis

Future Dates that fell on the Cardinal and Ordinal Crosses - shown on a Chart
Chart drawn using Profit Source (NOT included in GATE)
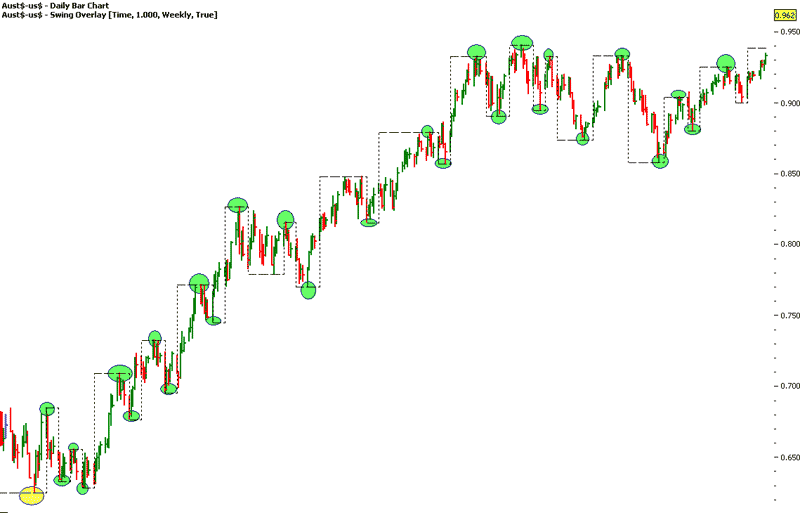
FXADUS Chart


The example - SPI (SHare Price Index - Australia) - using a previous Swing to construct the Square of Nine - and an analysis of the subsequent (future) Swings that were identified from the Square
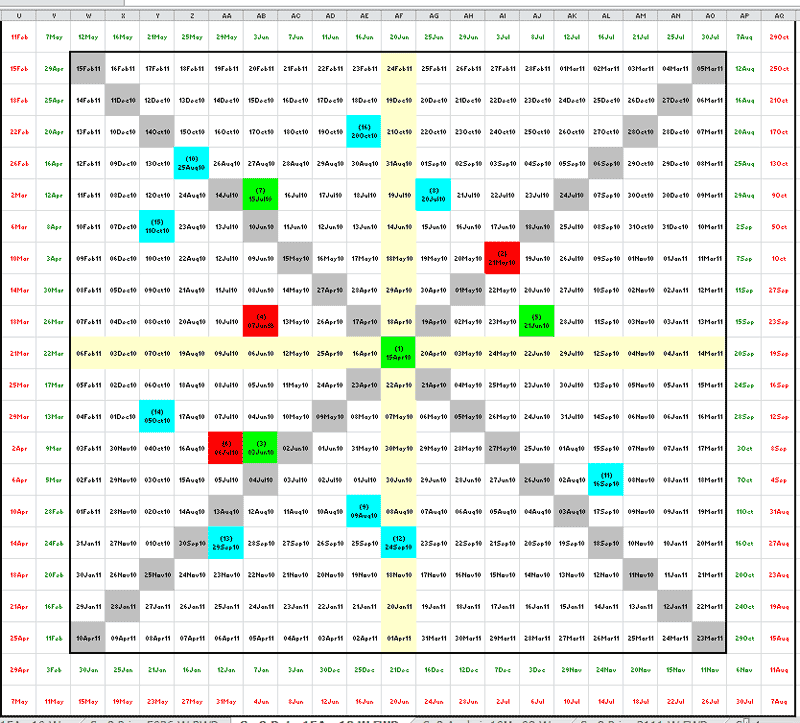
SPI Sq9

An Analysis of the FUTURE Dates (SPI) that fall on or near the Cardinal and Ordinal Crosses
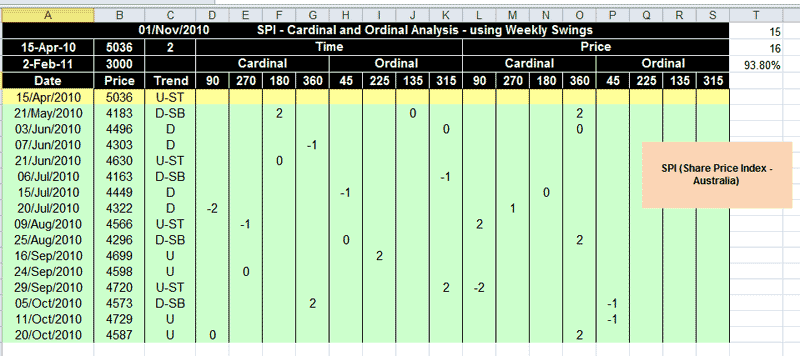
SPI  Analysis

Future Dates that fell on the Cardinal and Ordinal Crosses - shown on a Chart
Chart drawn using Profit Source (NOT included in GATE)
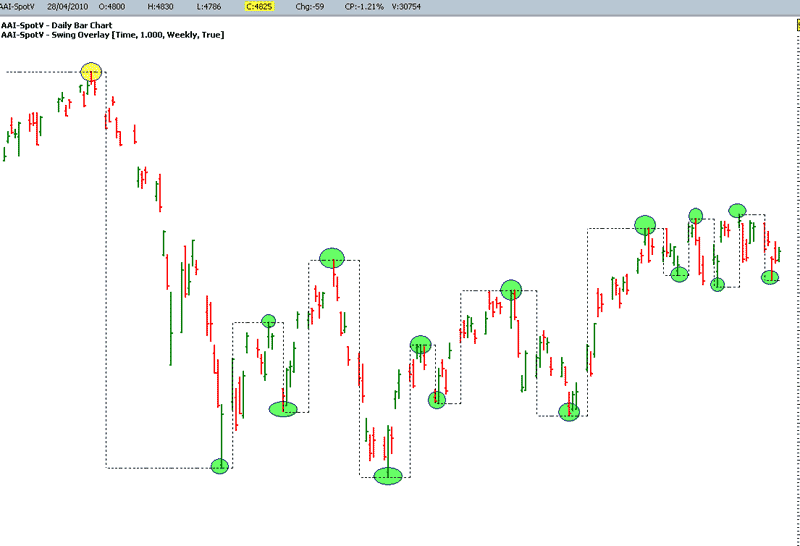
SPI Chart


graph

graph_002

need help?
If you are unsure of which version to order or encounter problems during ordering please contact us, we’d love to help. Click the button below to email us we will get back to you as soon as we can.

contact us