


GATE Packages
GATE Ultimate PLUS
GATE Fundamentals
GATE Functions
NEWSLETTER
Join our mailing list and stay in touch with the latest GATE news and research
![]()
Download Brochure
GATE – Cycle Finder
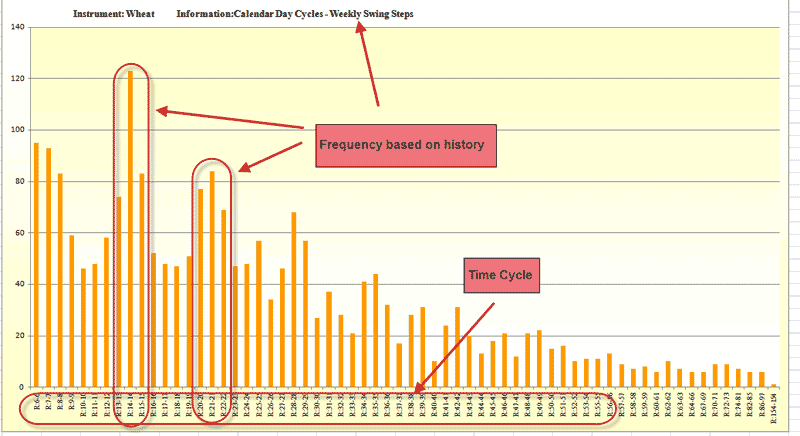
This GATE functions assist the Trader in identifying current cycles working in the Market. Analyze cycles through the use of graphs and highlight all occurrences of the selected time cycle. The analysis can be done on Calendar days, Trading days and price ranges.
Highlights
- Test any Cycle instantly.
- Options to select the graphs to include
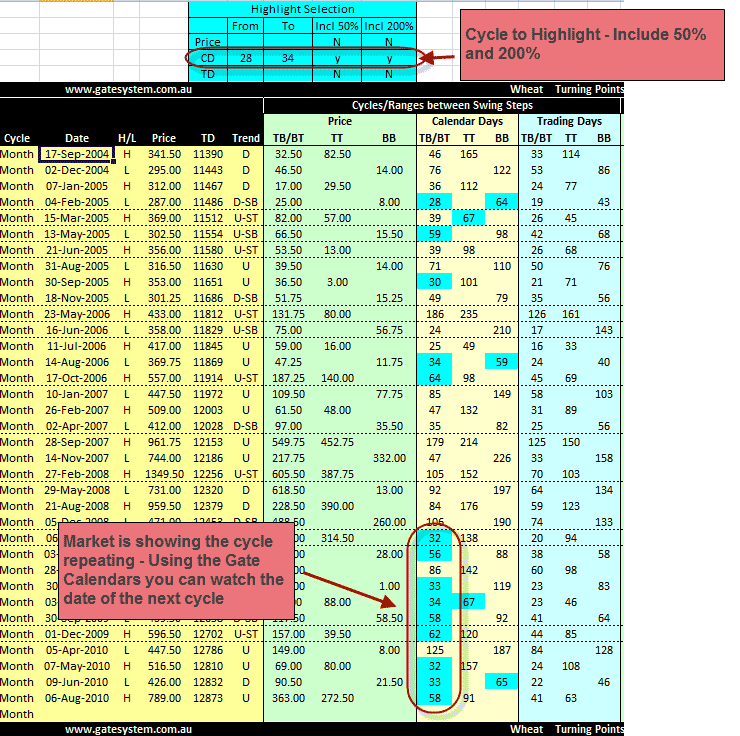
- Select the cycle to analyze and include 50% and/or 200% of the cycle in your analysis
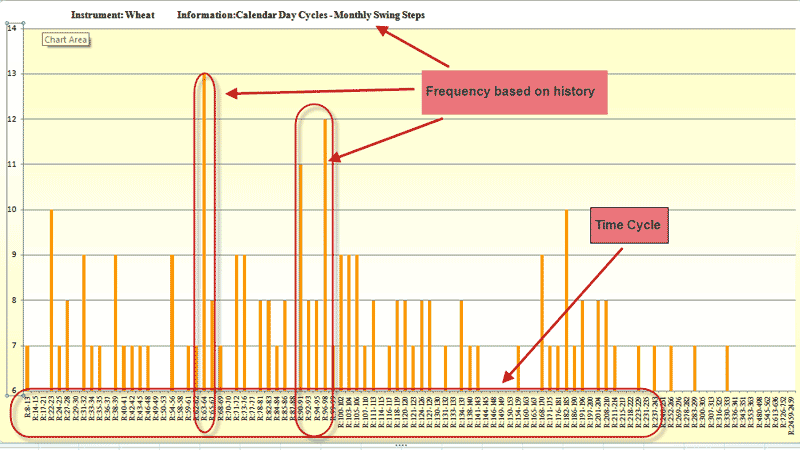
- GATE shows shorter time cycles (from the minor weekly swings) separate from the longer time cycles (major monthly swings) making it easier to identify both sets of cycles (that is short cycles and longer cycles)
Examples
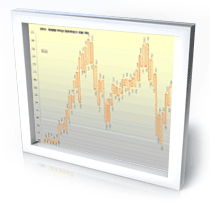
The example below shows the sorter term (weekly) swings and the more frequently used cycles
This example shows the longer time cycles by taken from the Monthly swings
An example of a study for the current time cycles. The display shows the cycles for swing steps as well as sing tops and bottoms.
The purpose here is to try to identify when the next swing is likely (probability- not certainty) to occur. This can then be plotted into the GATE calendar where other cycles can be analyzed and a date cluster may become obvious.
|
||

