


GATE Packages
GATE Ultimate PLUS
GATE Fundamentals
GATE Functions
NEWSLETTER
Join our mailing list and stay in touch with the latest GATE news and research
![]()
Download Brochure
GATE – Master Time Cycles – Statistics
With this function you can get to know key characteristics about your market within minutes. Keep the track of the All time High and All time Low. Find the month during which the most Lows or Highs made; what are the average time cycles and price ranges - top to bottom/bottom to top,top to top, bottom to bottom. Extract statistics for Calendar Days as well as Trading days. Trade with knowledge,trade with confidence.
Highlights
Statistics
- A number of statistics are extracted and kept up to date after data updates.
- Use of graph for ease of use
- .Know the Months and day of months during which the majority of swings are made
- Extract information based on Calendar Days as well as Trading Days
Examples
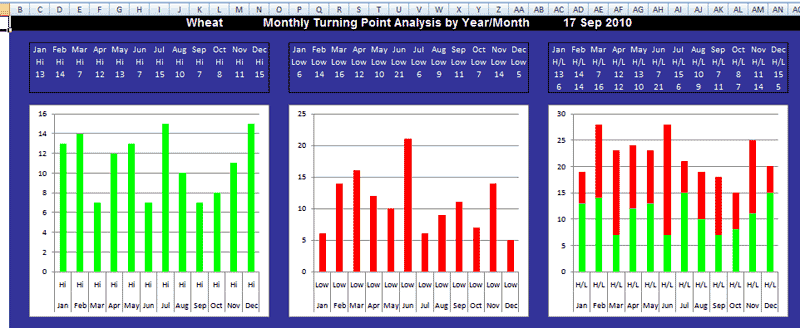
The example below shows the month during which the most Swing tops (Green) Swing Bottoms (Red) or total swings are made.
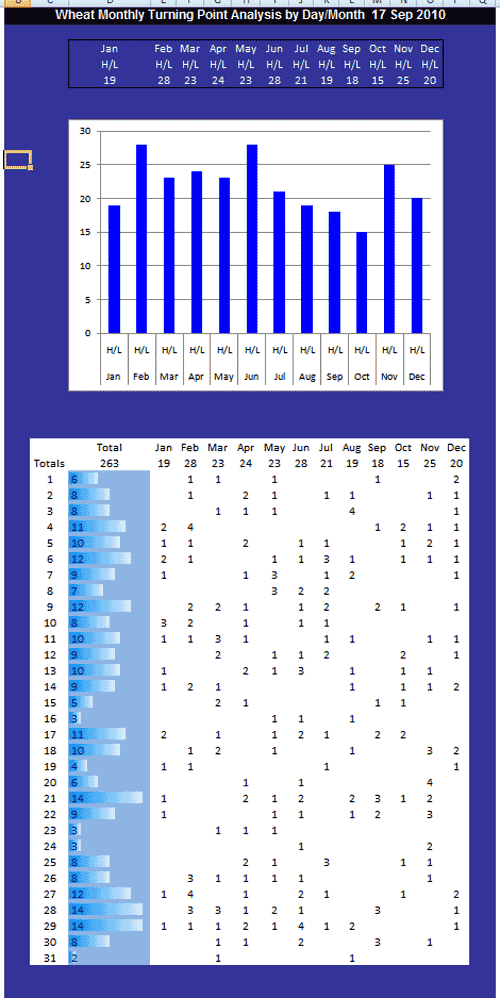
The Example below shows the most common day (in the month) when swings are made.
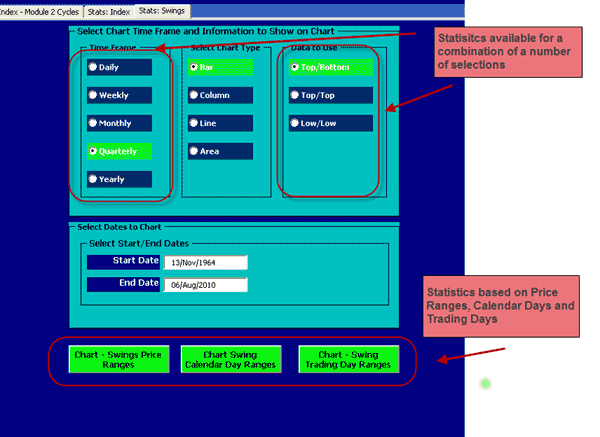
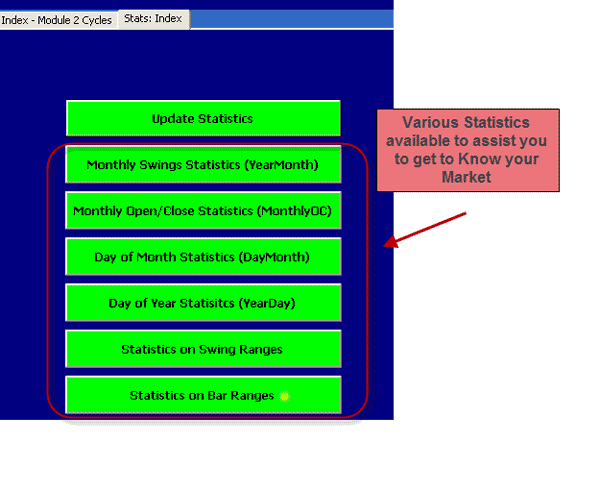
Select from a number of Menu Option
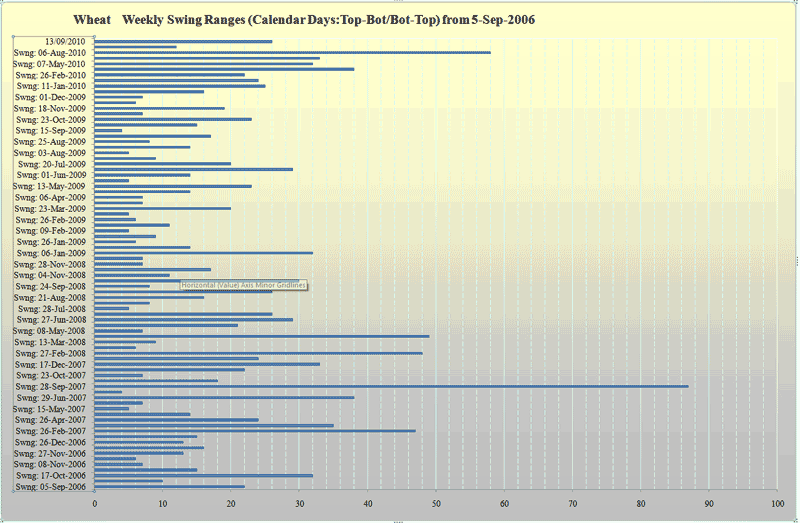
The Example below shows common (this example - time) between top to bottom ranges based on weekly swings.
|
||

