


GATE Packages
GATE Ultimate PLUS
GATE Fundamentals
GATE Functions
NEWSLETTER
Join our mailing list and stay in touch with the latest GATE news and research
![]()
Download Brochure
GATE – Swing Charts and Bar Charts
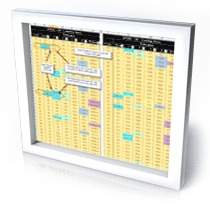
This functions includes GATE Swing Charts and Bar Charts for variety of time frames. GATE only requires End of Day data (open High Low Close) to operate
Highlights
Module 1 – Swing Charts, Bar Charts, and Data maintenance
- Create Daily, Weekly, Monthly, Quarterly or Annual Swing Charts.
- Create Daily, Weekly, Monthly, Quarterly or Annual Bar charts.
- Select the information you want included on the charts
- Market data maintenance - Insert/Delete Markets
- Choose method of data update - File Import (.csv, .txt, or SW file formats) or cut’SW’paste
- Updating the End of Day (EOD) data
- GATE automatically calculates the swings for each of these time frames.
View Video
This Video covers the recent enhancements made to include a 2 Bar, 3 Bar Swing Chart (with GANN Exception Rule). The Swings chart can be constructed based on Price Ranges or Time Ranges
![]()
Examples with Benefits
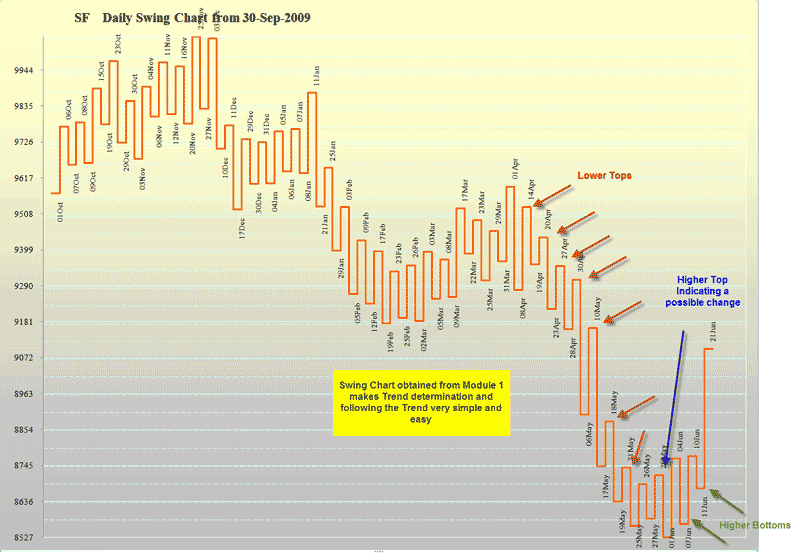
Follow the trend using the time frame you are trading in. Choose from Daily, Weekly, Monthly, Quarterly and Annual time frames
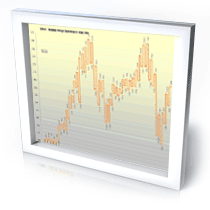
The example below shows the Date of the Swing on the Chart - You can also show the Time cycle between swings, the Price of the Swing and the Price Range of the Swing
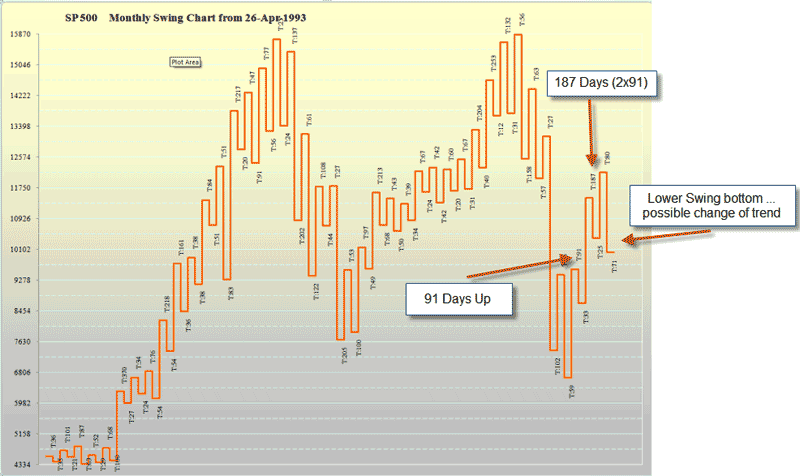
The Example below show using the Swing Chart to identify repeating Time Cycles and an "early" warning of a possible change of trend
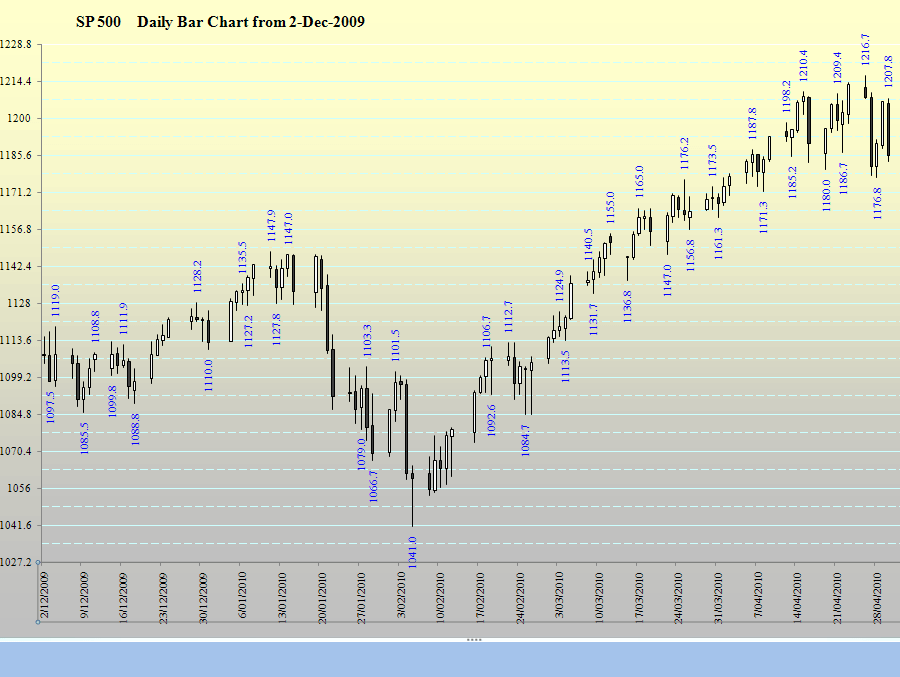
Bar Charts - you select the information you want displayed on the chart
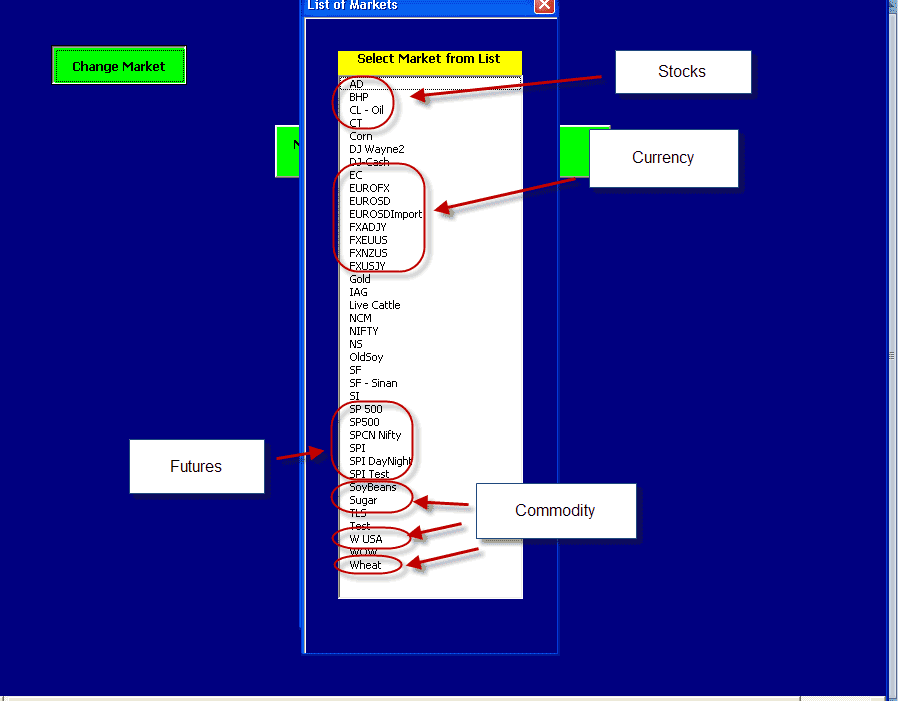
Use Gate for any Stock, Futures Contract, Commodity, Foreign Exchange.
Gate requires End of Day Data. Gate data only needs to be updated once a month, but it can be done more frequently if required.
You will be impressed with how quick and easy it is to use GATE to draw swing charts and bar charts for a market using your selected timeframe.
|
||
